You can analyze the performance of a scene using the Scene Debugger. This can tell you the processing time and memory consumed by the elements in your scene, and help you to find and correct things that are slowing it down.
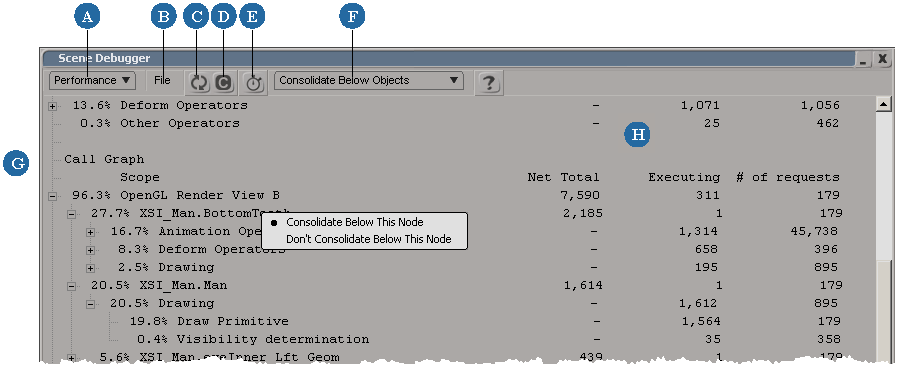
| A |
Switch between Performance and Memory. When you switch to Memory, you need to click Update. Switching to Memory flushes captured performance data, so you need to re-capture data when you switch back to Performance. |
| B |
Export to a text file, or set preferences. |
| C |
Update the display. Click this after you have stopped or started consolidating below nodes, or changed preferences. |
| D |
Clear the data. This also stops capture. |
| E |
Start or stop capturing performance data. This is required for displaying performance data. (Performance tab only) |
| F |
Controls how operators are grouped for display. (Performance tab only)
|
| G |
Information about performance or memory appears in this pane. On the Performance tab, you can right-click on certain nodes to control how the operators are consolidated, and then click Update. |
| H |
On the Performance tab:
For information about the Memory tab, see Displaying and Interpreting Memory Data. |
Here is a quick walk-through that outlines the general steps for profiling the performance of your scene:
Choose View  General Scene Debugger and make sure the Performance tab is displayed.
If necessary, choose File Preferences and set the Filtering threshold to filter out nodes that take very little time.
You can change this later and click Update. However it can take a long time to refresh the display depending on how much data there is to capture in your scene, so it's best to start with the value you want.
Select either Consolidate Below Objects or Consolidate Below Drawing Steps.
Again, you can change this later and click Update but it's best to start with the value you want.
Play back the scene, or interact with it (move deformers and so on).
The performance data appears in the Scene Debugger. To understand how to interpret it, see Interpreting Performance Data.
When you find a node that takes a long time to evaluate, you can investigate it further. You can right-click on the following types of node in the lower portion of the window (in the Call Graph section below the Category section):
The context menu contains a couple of mutually exclusive options:
Consolidate Below This Node. This option collects the operators called by the node into a list. It is useful when you want to simplify the presentation of the data.
Don't Consolidate Below This Node. This option shows you the entire nested call stack from that node down. It is useful for seeing exactly which node calls which.
These settings are stored per node. When you choose one of these commands, the display changes to Custom but it does not update right away. You can right-click on additional nodes to control how their operator calls are consolidated, and then click Update. Note that Custom settings for consolidation are not kept if you switch to another setting, so you cannot retrieve your previous view by switching back to Custom from the menu.
Also note that if you choose to consolidate below a node such as an operator, it will have no effect if the nodes are already being consolidated at some point above it in the call stack. You must stop consolidating from the object or drawing step above the operator to see the effect of consolidating below the operator.
Make some changes to the scene, and then repeat as desired:
When you have finished debugging, click Clear before closing the Scene Debugger window to discard the performance data.
Interpreting the data in the Scene Debugger can be tricky. For example, it may seem like a particular node is taking an unusually long time to evaluate, but that may only be because it is the first node to pull on an expensive operator that must be evaluated anyway. In such a case, modifying the scene so that the node doesn't pull on the expensive operator simply shifts the blame to another node. For another example, computing the transform of the left eye may require pulling on many inputs, but then computing the right eye may require only one since the others have already been evaluated.
The information on the Performance tab of the Scene Debugger is divided into 3 sections:
The first two lines show the time unit and filtering. You can simplify the data by filtering out nodes that are less than the Filtering threshold you set — see Scene Debugging Preferences [Preference Reference]. Note that you must click Update to refresh the data after you change the threshold.
The next section, labelled Category, displays summary information for every category of operator. This section is the same no matter how the data is consolidated in the main section. The categories are shown in descending order of evaluation times, and categories with long evaluation times are automatically expanded.
The main section, labelled Call Graph, displays the detailed timing data according to how you have chosen to consolidate the operators. Again, nodes are shown in descending order of evaluation times, and nodes with long evaluation times are automatically expanded.
Each top-level node represents a separate call stack. There is one for each geometry view, unless views have been muted or minimized. There may be additional ones that represent call stacks executed outside of drawing a view — for example, if you interact with a manipulator in Local mode then Softimage needs to evaluate the transforms of the hierarchy.
Operators are categorized by type in the summary near the top of the Scene Debugger.
By default, they are also categorized in the consolidated lists in the main section. This is controlled by Show the consolidated categories — see Scene Debugging Preferences [Preference Reference]. When this option is off, the consolidated operators are displayed as an uncategorized flat list.
The following table describes the categories:
| Animation Operators |
This category includes all animated transforms, including kinematics and constraints. |
| Deform Operators |
This category includes deformations. It does not include ICE trees that are used for deformations. |
| Drawing |
This category is divided into the following drawing steps:
|
| ICE Operators |
This category includes all ICE operators whether they are being used for deformation, simulation, and so on. You can profile the performance of ICE operators individually as described in Profiling the Performance of ICE Trees [ICE Guide]. |
| Objects |
This represents the overhead consumed by objects outside of operator evaluations. The values should be quite small. |
| OpenGL Render |
This represents the time taken to render the updated views. |
| Custom Operators |
This category includes scripted and custom compiled operators. |
| Scripts |
This includes any scripts that you ran while capturing performance data. |
| Tasks |
This includes any commands that you invoked while interacting. |
| Topology Operators |
This includes any operators that add or remove geometry components. |
| Other Operators |
This includes all operators that don't fall into one of the other categories, such as expressions (which may or may not represent animated transforms), cluster operators, and so on. |
| Events |
This includes any time spent processing events during data capture. |
The techniques for optimizing are very specific to individual scenes. However, there are some general strategies that you can apply:
If there is a great deal of time spent in Visibility Determination (usually due to the time to required compute the geometry), key the visibility of objects off while they are out of frame.
If much time is spent in Transform, try reducing it by plotting animation, caching geometry, and simplifying rigs.
To minimize time spent in Draw Primitive, look for unfrozen texture projections and similar things.
Compared to the Performance tab, the Memory tab is quite simple. You don't need to capture anything — just click Update. Note that when you switch back to the Performance tab, you need to recapture performance data.
The memory data is divided into two sections:
This gives you a rough idea of the memory used by the scene, but note that not every byte is accounted for.
If you see that there are data copies listed, this may indicate something that can be frozen to save memory. However, this is not always the case — copies can also represent internal data that will be removed automatically when no longer needed.
 Except where otherwise noted, this work is licensed under a Creative Commons Attribution-NonCommercial-ShareAlike 3.0 Unported License