


You can select different commands to modify the contents in the history and editing panes. You can access these commands from the context menus, command bar menus, or using the keyboard shortcuts.
In addition, there are many commands that are available only in the context menu of the editing pane. These commands make scripting easier in the editing pane and are explained in the following sections.
If you select one or more lines in the editing pane and then select Comment Out from the context menu, the selected lines are commented out (using the comment characters for the current language). To remove the comment characters, you can select Comment Remove from the context menu.
This is helpful when you want to run disjointed snippets of code in the editing pane as shown in the following example.
// I want to run this block
var root = Application.ActiveSceneRoot;
var n = Application.ActiveSceneRoot.AddNull();
PerformSomeNastyOperation( n );

// I don't want to run this if-clause
// if (n.Name == "null") {
//	root.AddNull();
// }

// I want to run this block
function PerformSomeNastyOperation( in_obj )
{
	// Does whatever...
}If you use different languages to implement and test code, the Set to <language> command is an easy way to switch between languages. This is an easy way to set the scripting language than using the File  Preferences Script Language drop-down list.
The supported scripting languages are color coded. For example, in Python the def keyword appears in blue, comments in green, and all strings appear in red.
You can use the commands in the Tools submenu to create and debug scripts.
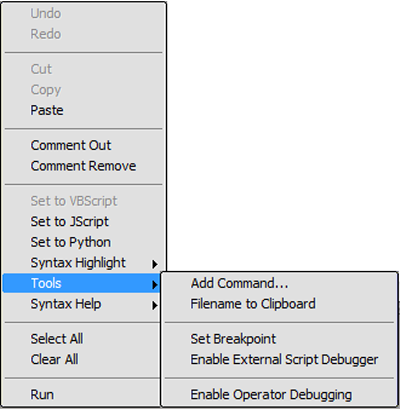
The following table describes these commands.
| Command | Description |
|---|---|
| Add Command | Launches the Custom Command Wizard. You can use the Custom Command Wizard to generate the code for a self-installing plug-in that contains a custom command. |
| Filename to Clipboard | Saves the full path and filename of the script file that is currently open in the script editor to the clipboard. |
| Set Breakpoint | Inserts a breakpoint call to the debugger for the current language at the insertion point (see Debugging Scripts). |
| Enable External Script Debugger(for JScript and VBScript only) | Enables Just In Time (JIT) debugging. JIT debugging invokes the Microsoft Script Debugger whenever your script either generates an error or contains a breakpoint (see Debugging Scripts). |
| Enable Operator Debugging | When operator debugging is enabled, extra debugging information from the plug-in is logged to history. |
You can use the options in the Syntax Help submenu to automatically insert different code snippets into the editing pane. The code snippets that you can insert are fundamental syntax constructions (standard for-loops, if-then-else clauses, and so on), intrinsic Softimage object creations (XSICollection, SIVector3, and so on), and more advanced constructions such as JScript and Python custom objects (depending on the language preference).
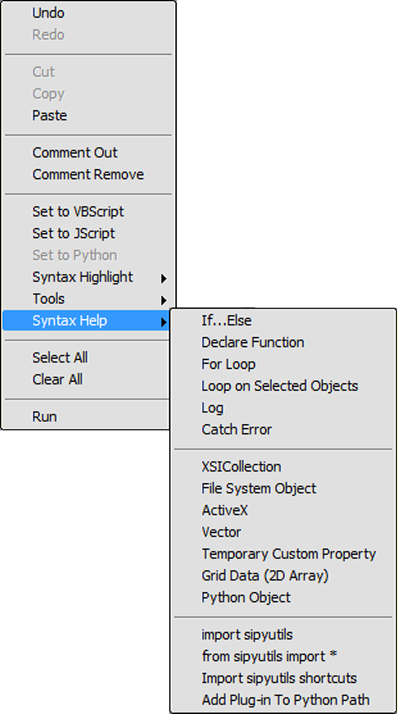
When you select an option in the Syntax Help submenu, a code snippet in the currently selected language is inserted at the cursor's insertion point (any selected text is replaced).
 Except where otherwise noted, this work is licensed under a Creative Commons Attribution-NonCommercial-ShareAlike 3.0 Unported License