Display normalized curves
To normalize your animation
curves
- Select the animated objects whose curves
you want to normalize.
- Open the Graph Editor.
The Graph
Editor appears with all the animation curves for the
selected objects displayed in the graph view.
- Do one of the following:
- In the Graph Editor menu
bar, select View > Display Normalized.
- In the Graph Editor tool
bar, click the Enable Normalized Curve Display icon
(
 ).
).
All the curves currently
displayed in the Graph Editor’s graph view are scaled
to fit within a range of -1 to 1. Only the displayed curves are
scaled, not the underlying animation.
To turn off normalized curve display
- Select the animated objects whose curves
you want to revert back to their non-normalized states.
- Open the Graph Editor.
The Graph
Editor appears with all the animation curves for the
selected objects displayed in the curve view.
- In the Graph Editor Outliner,
select the channels for which you want to turn off normalized display.
- Do one of the following:
- In the Graph Editor menu
bar, select View > Display Normalized.
- In the Graph Editor tool
bar, click the Disable Normalized Curve Display icon
(
 ).
).
The curves in the Graph
Editor graph view return to their original display.
To renormalize curves
- Select the animated objects whose curves
you want to re-normalize.
- In the Graph Editor Outliner,
select the channels for which you want to re-normalize curves.
- Do one of the following:
- In the Graph Editor menu
bar, select View > Renormalize.
- In the Graph Editor tool
bar, click the Renormalize curves icon (
 ).
).
All the selected curves
currently displayed in the Graph Editor’s
graph view are scaled to fit within a range of -1 to 1. Only the
displayed curves are scaled, not the underlying animation.
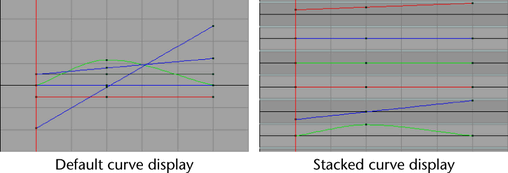
Display stacked curves
By default, curves are
displayed overlapping in the graph view. You can switch to view
a stack of individual curves.
To view a stacked display of curves
- Do one of the following:
- From the Graph Editor menu
bar, select View > Stacked Curves.
- Select View > Stacked Curves
>
 to open
the Stacked Curves Options window
and set additional display options. See
Stacked Curves Options window for
more information.
to open
the Stacked Curves Options window
and set additional display options. See
Stacked Curves Options window for
more information.
See also
Stacked Curves for
more information.
TipYou can change the
stacked curve background colors in the Animation Editors section
of the Color Settings (Window
> Settings/Preferences > Color Settings.)
ImportantWhen using the Scale
Keys Tool or the Lattice Deformer Keys
Tool with Stacked Curves turned on, you
can only modify the time value.
To turn off stacked display of curves
- From the Graph Editor menu
bar, select View > Stacked Curves again.
TipYou can also toggle
Stacked
Curves on and off quickly using the
Enable Stacked
Curve Display 
and
Disable
Stacked Curve Display 
icons
in the
Graph Editor toolbar.
Display directly connected
curves only
You can limit which curves
display in the graph view for a selected channel.
To have only directly connected curves
display in the graph view
- In the Graph Editor Outliner,
select the channels whose curve display you want to limit.
- From the Graph Editor menu
bar, turn off the List > Show Upstream Curves option.
To have all curves display again for
the selected channel
- Turn on List > Show Upstream
Curves in the Graph Editor menu
bar.