


Learning Resources > Tutorials > Getting Started with Maya > Animation > Lesson 1: Keyframes and
the Graph Editor >
Using the Graph
Editor
For a more convincing animation, you need to bounce the ball more sharply off the ground and speed up the ball’s horizontal movement. You’ll use the Graph Editor to make both modifications.
The Graph Editor is an editor that graphically represents the various animated attributes in your scene. The animated attributes are represented by curves called animation curves. You edit animation curves in the Graph Editor.
To edit animation curves using the Graph Editor
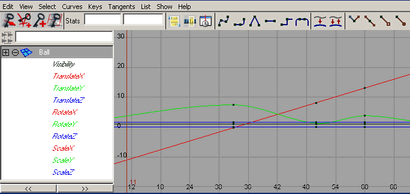
The Graph Editor displays several animation curves, one for each keyed attribute of the ball. The animatable attributes for the ball are listed in the left column. Specifically, it displays the attributes of the selected transform node of the ball.
Each curve graphs how an attribute changes value during the animation. The column of numbers at the left represents attribute values that can be animated, while the row of numbers at the bottom represents time (frame) values. At each point on the curve, you can see the value of an attribute at a particular time. The small black squares on the curves represent points where you’ve set keys.
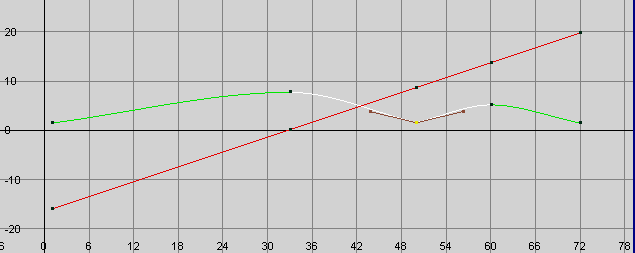
Now only the animation curves for Translate X and Translate Y appear in the Graph Editor.
This simplifies the display. With too many curves present, it’s hard to see specific curves. When you use the Graph Editor, you usually focus on one or a few curves.

The green curve represents Translate Y, while the red represents Translate X. The color of each curve matches its attribute name. This color scheme is consistent throughout Maya for X, Y, and Z (red, green, blue).
If you’ve never used a graph editor before, the relationship between a curve’s shape and the animation it represents might be hard to understand. With experience, you’ll quickly recognize how curve shape affects animation.
In the above graph, the straight curve of Translate X indicates that the ball moves horizontally across the ground at a constant rate over time.
The wavy curve of Translate Y indicates that the ball increases its height steadily until frame 33, dips more quickly until frame 50, then rises and dips again until frame 72.
When the ball first bounces off the ground at frame 50, it seems to float and slip rather than rebound. The shape of the Translate Y curve illustrates why. Near frame 60, the curve is soft and rounded. The Translate Y values gradually decrease to the low point then gradually increase. The transition from decreasing to increasing values is smooth.
The Graph Editor’s usefulness lies in the fact that you can edit the shape of the animation curves to edit the animation of any keyed attribute. To create a sharp bounce, you can edit the curve so that the transition from decreasing to increasing values is abrupt at frame 50. Specifically, you’ll create a corner at that key point rather than a rounded curve.
Animation curves have a few control structures for curve editing. You can do any of these operations:
(You can shift-drag with the Move tool to constrain a move operation to a single direction.)
This changes the curvature around the key point from rounded to cornered. Specifically, the setting you select specifies how the key point tangent handles lie at this key point. This affects the type of interpolation between key points.
To sharpen the bounce more, you need to edit the positioning of the tangent handles to steepen the curvature approaching the key point.
By default, when a pair of tangent handles share a key point, they work as a unit. Move one and you move the other in an opposing direction. This is often desirable in an animation curve, because it ensures the curvature at that point stays symmetrical. Symmetrical curvature often helps prevent unusual animation shifts.
In this case, however, you want to steepen the curvature’s approach toward the curve point in the same direction on both sides. You therefore need to break the symmetrical interdependency between the two tangents.
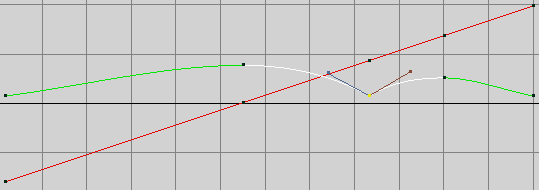
This sharpens the bounce to simulate the effect of gravity and elasticity.