 Command entry: Material/Map Browser
  Choose a map type (Bitmap, Cellular, Falloff, Gradient, Gradient Ramp, Mix, Noise, or Output). Output rollout
After applying a map and setting its internal parameters, you can adjust its output parameters to determine the rendered appearance of the map.
Also, the results of the Output rollout settings are visible in the Material Editor, but not in viewports with map display enabled.
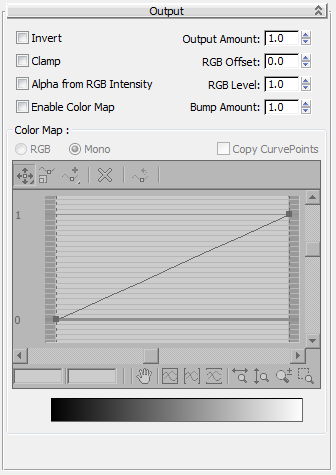
These controls appear on the Output rollout for a number of 2D and 3D maps:
Multiplies the RGB values of the map colors by the amount set by the spinner, which affects the saturation of the color. Eventually the map becomes fully saturated and self-illuminated. Lowering the value decreases the saturation and makes the map colors grayer. Default=1.0.
Adjusts the amount of bumpiness. This value has an effect only when the map is used as a bump map. Default=1.0.
For example, suppose you have a map instanced for both the Diffuse and the Bump components. If you want to adjust the amount of bumpiness without affecting the Diffuse colors, adjust this value, which changes the amount of bumpiness without affecting the map's use in other material components.
The Color Map settings at the bottom of the Output rollout are available only when Enable Color Map is on (see preceding).
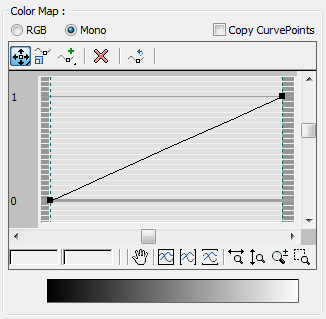
The Color Map graph lets you adjust the tonal range of an image. The point at 1,1 controls highlights, the point at 0.5,0.5 controls midtones, and the point at 0,0 controls shadows.
You adjust the shape of the graph by adding points to the line and moving or scaling them. You can add Corner, Bezier-Smooth, or Bezier-Corner points. When a move or scale option is active, points can be selected much like objects in a viewport, by clicking a point, dragging a region around one or more points, and holding down Ctrl to add or subtract from the selection.
When you select an individual point, its exact coordinates are displayed in the two fields below the graph at the lower left. You can enter values directly in these fields, but the values are automatically constrained as they are when you manually move or scale a point.
You can zoom into the graph to make detailed adjustments. As you zoom in, the graph updates to show decimal measurements along the left vertical axis. You can pan anywhere on the graph with the horizontal and vertical scroll bars, use a button option, or the middle mouse button. Points can be deleted, and you can reset the graph to its default at any time.
When on, points added to a Mono graph are copied when you switch to an RGB graph. If you start with an RGB graph, the points are copied to a Mono graph. You can animate the control points but not the Bezier handles.
 Moves a selected point in any direction, limited by the unselected points on either side.
 Constrains movement to the horizontal.
 Constrains movement to the vertical.
On a Bezier smooth point, you can move the point or either handle.
 Scale Point
Changes the output amount of control points while maintaining their relative position. On a Bezier corner point, this control is effectively the same as a vertical move. On a Bezier smooth point, you can scale the point itself or either handle. As with the move controls, scale is limited by the unselected points on either side.
 Adds a Bezier corner point anywhere on the graph line. The point makes a sharp angle when moved.
 Adds a Bezier smooth point anywhere on the graph line. Handles attached to the point create smooth curves when moved.
When either Add Point button is active, you can use Ctrl+click to create the other type of point. This eliminates the need to switch between buttons.


 Delete Point
 Reset Curves
 Pan
Pan Zoom Extents
 Zoom Horizontal Extents
 Zoom Vertical Extents
 Zoom Horizontally
 Zoom
Zoom Zoom Region